Block diagrams provide a simplified visual representation of a system's major components and their interconnections, helping you understand the overall process flow without detailed instrumentation or control information. P&IDs (Piping and Instrumentation Diagrams) offer a comprehensive, detailed layout of piping, instrumentation, and control devices, essential for design, operation, and maintenance within industrial processes.
Table of Comparison
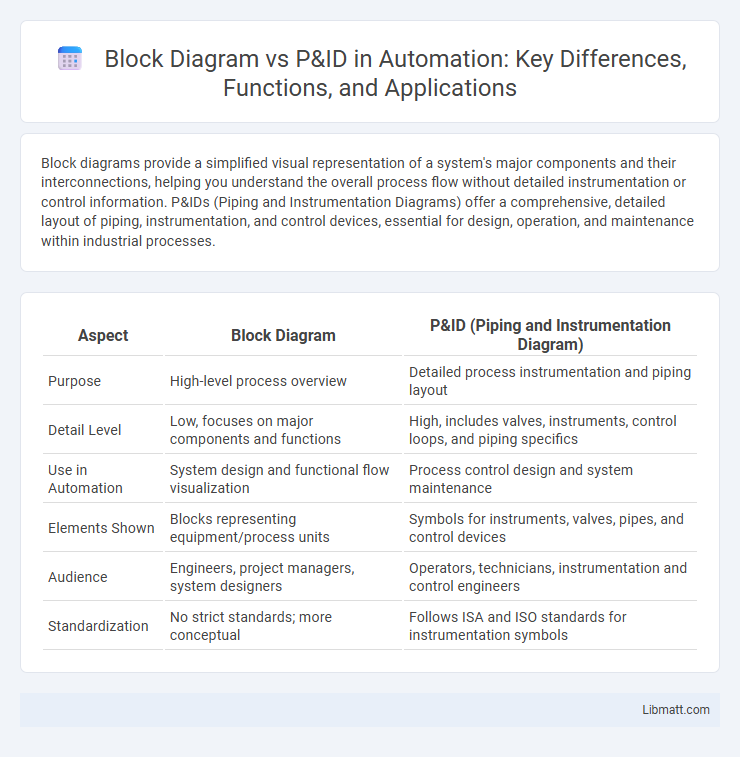
| Aspect | Block Diagram | P&ID (Piping and Instrumentation Diagram) |
|---|---|---|
| Purpose | High-level process overview | Detailed process instrumentation and piping layout |
| Detail Level | Low, focuses on major components and functions | High, includes valves, instruments, control loops, and piping specifics |
| Use in Automation | System design and functional flow visualization | Process control design and system maintenance |
| Elements Shown | Blocks representing equipment/process units | Symbols for instruments, valves, pipes, and control devices |
| Audience | Engineers, project managers, system designers | Operators, technicians, instrumentation and control engineers |
| Standardization | No strict standards; more conceptual | Follows ISA and ISO standards for instrumentation symbols |
Introduction to Block Diagrams and P&IDs
Block diagrams provide a simplified representation of a system's major components and their interconnections, focusing on overall structure without detailed instrumentation. Piping and Instrumentation Diagrams (P&IDs) offer a detailed illustration of piping, equipment, instrumentation, and control devices, essential for process design and maintenance. Both diagrams serve distinct purposes in process engineering, with block diagrams emphasizing the general flow and P&IDs highlighting precise operational details.
Definition of Block Diagram
A Block Diagram is a simplified graphical representation used to illustrate the functional relationships and flow between different components or systems without detailing the specific physical connections. It focuses on the overall system operation by depicting blocks representing subsystems or equipment and the interconnecting lines symbolizing signal or data flow. Your understanding of system design can be enhanced by using Block Diagrams for high-level conceptual visualization before diving into detailed P&IDs.
Definition of Piping and Instrumentation Diagram (P&ID)
A Piping and Instrumentation Diagram (P&ID) is a detailed schematic that illustrates the piping, instrumentation, and control devices within a process system, offering precise information on equipment and valve specifications. It differs from a block diagram by providing a comprehensive layout of physical components, including flow directions, chemical specifications, and safety measures. Understanding your system through a P&ID enables accurate process control, maintenance, and troubleshooting.
Key Elements in Block Diagrams
Block diagrams primarily depict high-level process flow through simplified symbols representing major system components such as equipment, instrumentation, and control systems. Key elements include blocks to represent system units, lines indicating process flow, and basic control signals that outline interactions without detailed specifications. This abstraction aids in understanding overall process relationships and system architecture before delving into detailed engineering designs found in P&ID drawings.
Key Components in P&ID
P&IDs (Piping and Instrumentation Diagrams) consist of key components such as pipes, valves, instruments, and control devices that illustrate the detailed flow and control of process systems. Symbols representing equipment like pumps, compressors, and heat exchangers are standardized to ensure clarity and accurate interpretation in process engineering. Unlike block diagrams, P&IDs provide granular information essential for system operation, maintenance, and safety analysis.
Purpose and Applications of Block Diagrams
Block diagrams simplify complex systems by representing major components and their relationships, making them essential for high-level design and conceptual understanding in engineering and control systems. They are widely used in early project stages for planning, system analysis, and communication between multidisciplinary teams. These diagrams assist in identifying system boundaries and interfaces without detailing physical components, unlike P&ID, which focuses on detailed process and instrumentation specifics.
Purpose and Applications of P&IDs
Piping and Instrumentation Diagrams (P&IDs) are detailed engineering drawings used for designing, operating, and maintaining process plants, illustrating the interconnection of process equipment and instrumentation. P&IDs serve as critical documents in plant safety, troubleshooting, and process control by providing precise information on valves, sensors, controllers, and piping details. Their applications span across industries such as chemical processing, oil and gas, and power generation, aiding engineers, technicians, and operators in ensuring efficient and safe plant operations.
Major Differences Between Block Diagram and P&ID
Block diagrams provide a simplified representation of a system's overall structure using basic shapes to illustrate components and their relationships, while P&IDs (Piping and Instrumentation Diagrams) offer detailed schematics that include piping, instrumentation, control devices, and process flow. The block diagram emphasizes functional relationships and system overview without specifying exact equipment or piping details, whereas P&IDs include precise specifications such as line types, valve symbols, instrumentation tags, and operational details essential for system fabrication and maintenance. Block diagrams serve primarily for conceptual design and communication, whereas P&IDs are critical for engineering, construction, and operational troubleshooting in process industries.
Advantages and Limitations of Each Diagram
Block diagrams offer clear visualization of system components and their interconnections, making them ideal for high-level design and communication. Their simplicity limits detailed representation of processes, equipment, and instrumentation, which can obscure critical operational details. Piping and Instrumentation Diagrams (P&IDs) provide comprehensive depictions of instrumentation, control devices, pipes, and valves, enabling precise process control and troubleshooting but can be complex and harder to interpret for non-specialists.
Choosing the Right Diagram for Your Project
Selecting the appropriate diagram between Block Diagram and P&ID depends on the project phase and detail requirements. Block Diagrams offer a high-level overview ideal for conceptual design and initial system layout, emphasizing functional relationships without detailed components. P&IDs provide comprehensive schematics with precise instrumentation and control details essential for engineering, construction, and operational phases.
Block Diagram vs P&ID Infographic